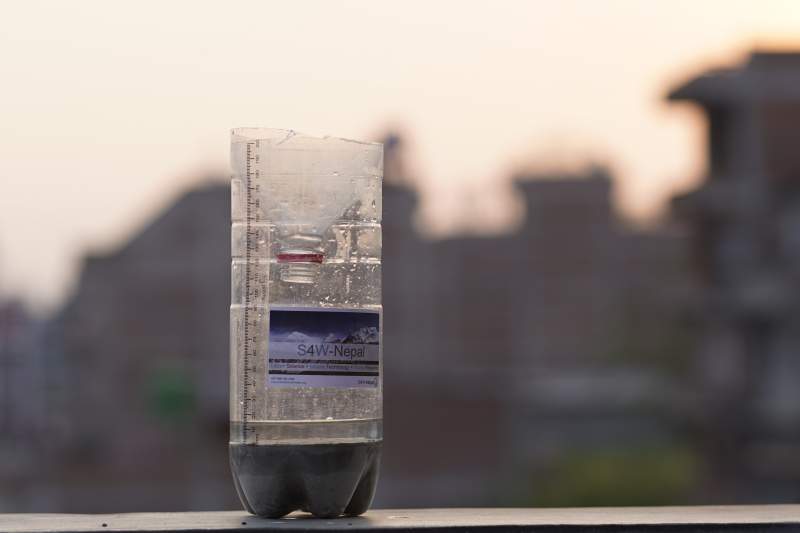
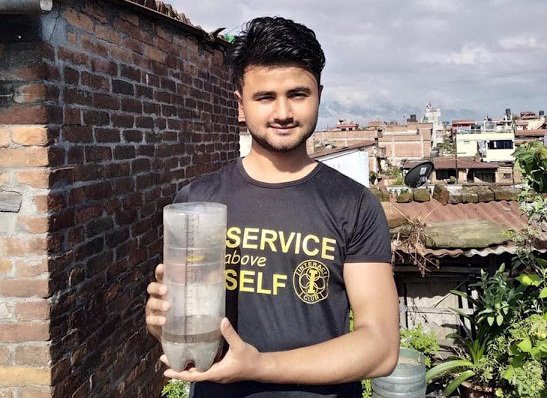
Citizen science is an approach to science that engages and includes the general public in scientific research, which has the benefits of connecting the general public with professional scientists and increasing their scientific understanding (Keyles, 2020). Smartphones For Water Nepal (S4W-Nepal) appreciates these benefits and employs this approach. For more than four years S4W-Nepal has conducted the Monsoon Expedition in the Kathmandu Valley (Valley) by mobilizing citizen scientists, mobile technology, and young researchers to measure precipitation during the monsoon (roughly May to September). The citizen scientists use a cost-effective rain gauge and an android phone to perform daily rainfall measurements. The S4W-Nepal rain gauge is made of recycled clear plastic bottles (Coke or Fanta) of 2.15 liters having a uniform diameter of 100 mm, a concrete base, and a ruler with millimeter gradations (Figure 1).
Figure 1: S4W rain gauge
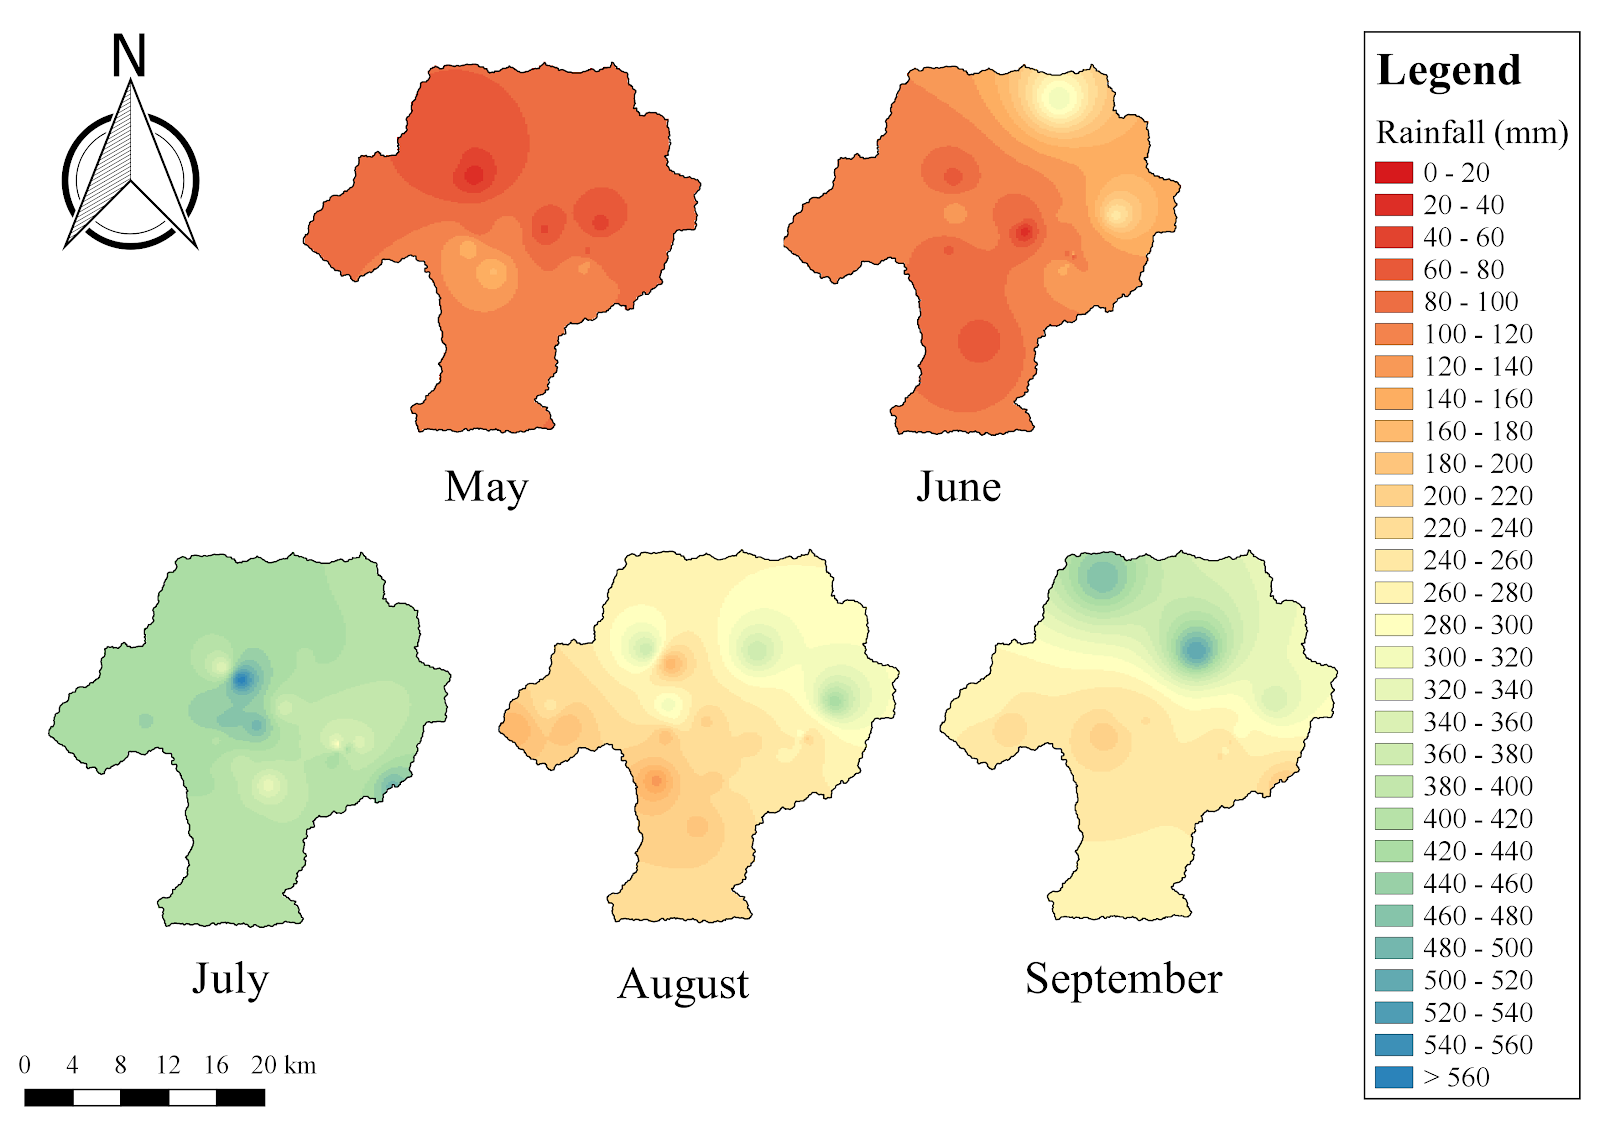
Figure 2: Monthly cumulative rainfall distribution in the Kathmandu Valley for monsoon 2019.
For the 2019 Monsoon Expedition, S4W-Nepal recruited and trained 55 enthusiastic citizen scientists to monitor rainfall in different parts of the Valley. Through this, a good set of spatial rainfall data from May to September of 2019 of the Valley was generated. In 2019, the monsoon entered Nepal in the third week of June (DHM, 2019). Heavy rainfall was observed in July in the Valley which triggered flooding in several rivers, adversely affecting the settlements near the river corridors (Uprety, 2019). In order to understand the spatio-temporal variation of rainfall in the Valley, the daily rainfall measurements recorded by the CS (after quality control) were considered and a spatial map (May-September) was prepared by interpolating the CS point coverage to a continuous valleywide coverage (Figure 2). The data generated by citizen scientists show that rainfall was highest in the month of July (mean= 417.63 mm), followed by September (mean = 287.68) and August (mean = 250.44 mm) (Figure 2).
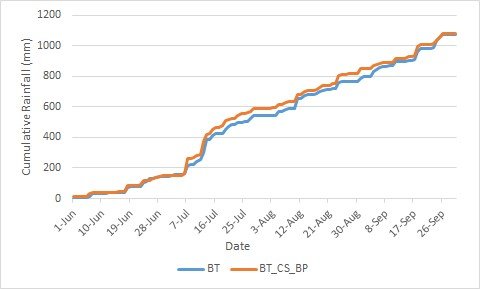
According to Davids et al. (2019), the S4W rain gauge used by citizen scientists for taking rainfall measurements is estimated to have an error of 2.9% compared to a standard Department of Hydrology and Meteorology (DHM) gauge. As an additional evaluation of the citizen scientists’ rainfall data from the S4W rain gauge in comparison to the DHM gauge, the CS stations located near the DHM stations (i.e., co-located stations) were chosen by generating Thiessen polygons in QGIS and identifying polygons with both a DHM gauge and CS station. Then, 17 co-located stations resulting from this process were selected to directly compare with the standard DHM rain gauge in the Valley. Only overlapping data from May to September 2019 were used for statistical comparison. The data of citizen scientists were correlated with the respective DHM stations based on Pearson correlation coefficient method to determine their relationship. The correlation between 10 co-located stations was found to be strong (above 0.60), 5 co-located stations were moderate (between 0.40-0.59), and 2 co-located stations were weak (below 0.39). The correlations for all stations were statistically significant at 0.01 significance level except for two; differences at the two stations may be due to greater distances between DHM and CS stations in these locations (~1.5 km for Sakhnu and ~0.5 km for Naikap). The times series of cumulative rainfall suggests that there is a similar trend of rainfall in both DHM and citizen scientists’ stations (Figure 3).
Figure 3: Time series of cumulative rainfall amount from June to August 2019 of Bhaktapur DHM station (BT) and citizen scientist station (BT_CS_BP)
These results demonstrate that citizen science can be a feasible approach for collecting reliable rainfall data, along with educating the citizen scientists about the need and applications of hydrometeorological data. Also, the simple and cost-effective S4W-Nepal rain gauge is accurate enough to generate reliable rainfall measurement data. Therefore, citizen scientist networks should be further expanded to other regions in Nepal to fulfill the hydro-meteorological data gaps that exist. Furthermore, citizen scientists should be educated, trained, and motivated to complete regular rainfall measurements since these data can have a big impact in the field of research and support better water resource management decisions, along with raising awareness with citizens about the complexity and value of managing this precious resource.
References
Davids, J. C., Devkota, N., Pandey, A., Prajapati, R., Ertis, B. A., Rutten, M. M., Lyon, S. W, Bogaard, T. A. and Giesen, N. V. (2019) Soda Bottle Science—Citizen Science Monsoon Precipitation Monitoring in Nepal. Frontiers in Earth Science [online]. 7. Available from DOI: 10.3389/feart.2019.00046.
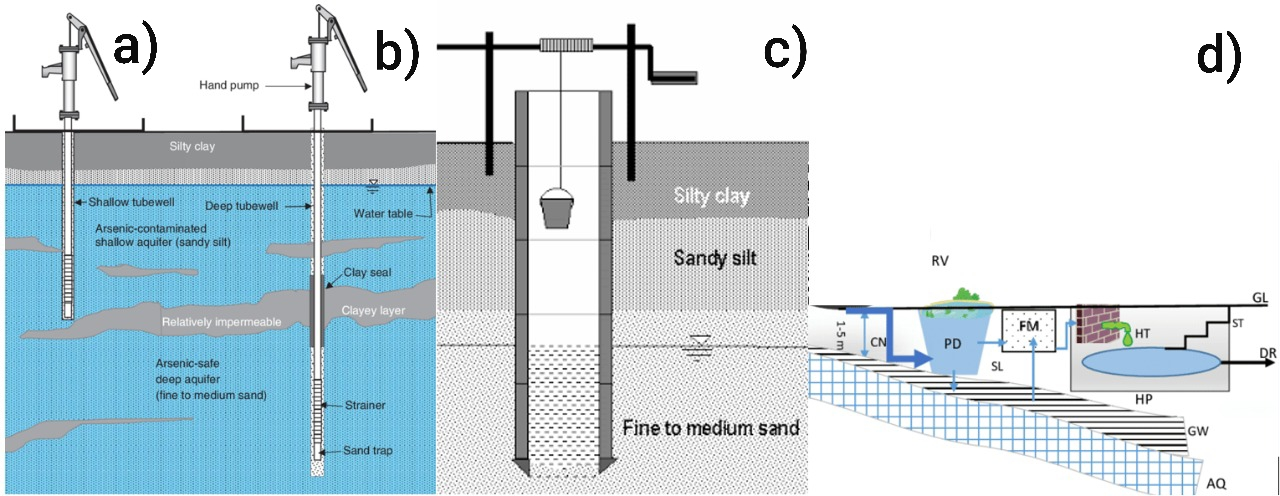
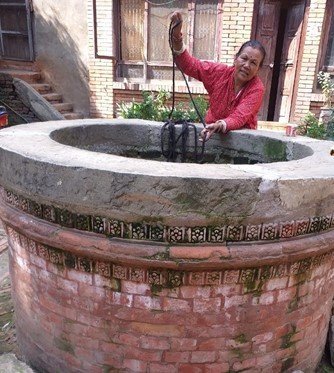
Groundwater, the water present in the spaces between rock and soil particles of the saturated zone underneath the earth’s surface, is a major source of freshwater for sustaining both global human civilizations and ecosystems (Earman and Dettinger, 2011). In the Kathmandu Valley of Nepal (Valley), groundwater is widely used for various purposes, including drinking and agriculture. The major sources of groundwater in the Valley include dug wells, tube wells, stone spouts, and deep tube wells (Figure 1).
Figure 1: Schematic diagram of different sources of groundwater a) shallow tube well, b) deep tubewell, c) dug well and d) stone spout: RV = Reservoir, CN = Canal (Rajkulo), PD = Pond, FM = Filtration media, SL= Supply line, HT = Hiti, HP = Hiti platform, DR= Drainage (overflow), GW = Groundwater, AQ = Aquifer (confined), GL = Ground level, ST = Stairs (Ahmed, 2002; Ahuja et al., 2014; Ghimire and Johnston, 2015)
More than 50% of the water demand of the Valley is supplied by the groundwater (Aryal, 2011; Shrestha, 2017), and approximately 60 Million-Litres-a-day (MLD) of the total municipal water supply is extracted from various groundwater resources (Dhakal, 2010). Additionally, mechanized groundwater extraction is widespread in the Valley due to the uneven distribution of water resources in the Valley, an inadequate municipal water supply, and other factors. Overall, the groundwater extraction rate is six times higher than its natural recharge capacity, resulting in the groundwater table being lowered by approximately 2.5 meters per year (Shrestha, 2009). This extensive extraction of groundwater in the Valley is a result of diverse anthropogenic activities and demands regular monitoring of groundwater levels.
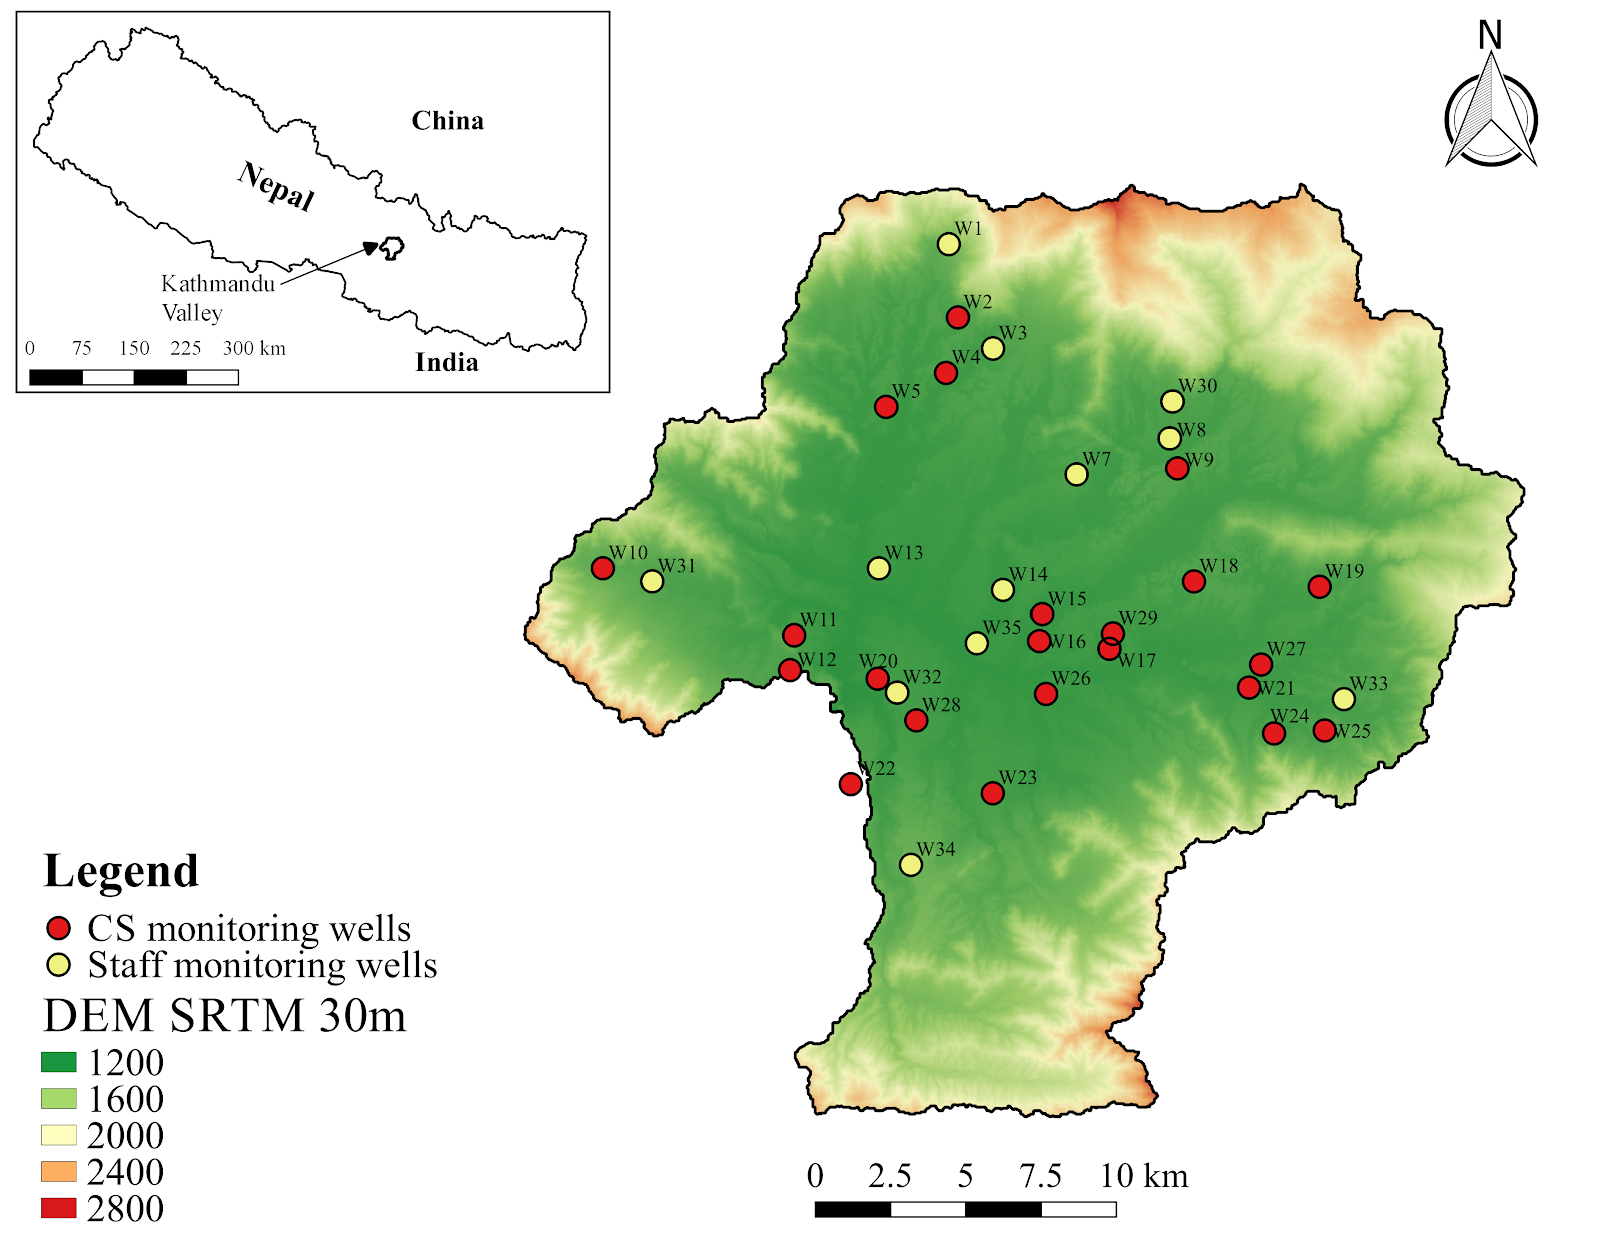
Therefore, Smartphones For Water Nepal (S4W-Nepal) started monitoring groundwater levels in the Valley in 2017 through a citizen science approach. Citizen science engages the general public in the scientific research design, data collection, analysis, and other scientific works in collaboration with professional scientists (Cappa et al., 2018). Also, it increases the scientific knowledge of the local people or Citizen Scientists (CS), in this example with regards to groundwater level fluctuations. We at S4W-Nepal intend to continue to monitor groundwater levels and expand our data’s spatial coverage by following this feasible and sustainable approach. In order to monitor groundwater levels, we have selected certain existing wells in the Valley, considering their spatial location and distribution. Figure 2 shows the location of regular monitoring wells of S4W-Nepal, including both CS and staff sites. Unlike other water resources monitoring projects, S4W-Nepal promotes sustainable monitoring of groundwater resources by converting the existing wells into monitoring wells and involving CS in collecting groundwater level data. In the middle of every month, our citizen scientists record the groundwater level with a measuring tape and an android application called Open Data Kit (ODK) Collect. The CS can easily record the date and time of data collection, location of monitoring well, and the depth to water in meters (along with photos taken on site) through a customized form developed by S4W-Nepal in ODK Collect and forward it to the server of S4W-Nepal. Once data are received, we perform quality control and do immediate follow-up calls to minimize errors.
S4W-Nepal’s Citizen Scientists for monitoring groundwater level
We recruit most of our CS through a variety of outreach programs, social media, and personal contacts. There is no age, gender, and educational restriction to become a CS; anyone interested in the scientific process of data collection can become a CS. To date, S4W-Nepal has recruited and trained 86 CS to monitor groundwater levels. Understanding groundwater level variation and supporting the sustainable management of groundwater resources motivates our CS to collect the data regularly. The age of CS involved in S4W-Nepal for monitoring gw level data ranges between 15 – 33 years, and the majority of them are students from different educational backgrounds. Out of our 86 CS, 40 (46.5%) are female and 46 (53.5%) are male. We currently have 23 regular CS collecting monthly groundwater level data from different locations of the Valley. We regularly communicate with our CS through follow up calls/SMS with monthly reminders or follow-up on data collection, to see if they have any questions, and to encourage them to continue data collection and their involvement. One of the challenges of citizen science projects is maintaining and seeking to improve the engagement of CS over time.
Temporal variation of groundwater levels in the Valley
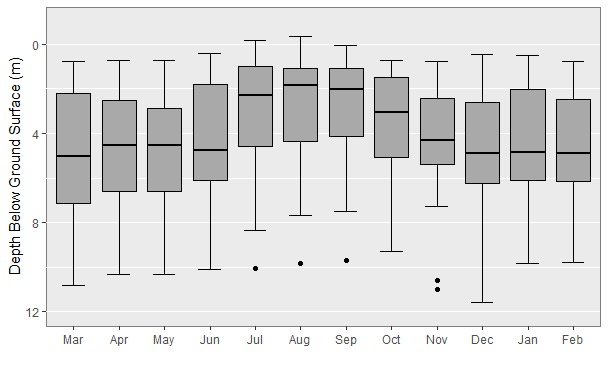
Based on the groundwater level data collected by our CS from March of 2019 to February of 2020, a preliminary analysis has been done to understand the temporal variation of groundwater levels of the Valley (Figure 3). Data from 35 regular monitoring wells have been taken into consideration in this analysis.
The boxplot below reveals the monthly fluctuations of groundwater in the time period of 1 year. The groundwater level is maximum during the monsoon season (June- September), and the groundwater level is lowest in December of 2019 (i.e., post-monsoon period). Also, the groundwater levels dropped sharply from October of 2019, the beginning of the post-monsoon period. This indicates the direct influence of rainfall on the groundwater level.
Figure 3: Boxplot showing the monthly groundwater level fluctuation
Despite the critical need for groundwater monitoring, there is still a significant data gap that needs to be closed to better understand groundwater fluctuations across the Valley and under varying conditions. Therefore, the regular monitoring of the groundwater level by using a citizen science approach should be continued and expanded. Besides, it will make the general public more aware of groundwater conditions, more actively involved in monitoring and managing this critical resource, and will promote proper groundwater resources management.
Ahuja, S., Larsen, M. C., Eimers, J. L., Patterson, C. L., Sengupta, S. and Schnoor, J. L. (2014) Comprehensive water quality and purification. Waltham, MA: Elsevier.
Aryal, R. S. (2011). Ground water reality.New Spotlight. 4(19). March 25, 2011.
Cappa, F., Laut, J., Porfiri, M. and Giustiniano, L. (2018) Bring them aboard: Rewarding participation in technology-mediated citizen science projects. Computers in Human Behavior [online]. 89, pp.246-257. Available from DOI: 10.1016/j.chb.2018.08.017
Earman, S. and Dettinger, M. (2011) Potential impacts of climate change on groundwater resources – a global review. Journal of Water and Climate Change [online]. 2(4), pp. 213–229. Available from DOI: 10.2166/wcc.2011.034
Ghimire, S. and Johnston, J,M. (2015) Traditional Knowledge of Rainwater Harvesting Compared to Five Modern Case Studies. Conference: Environmental and Water Resources Congress 2015 [online]. Available from DOI: 10.1061/9780784479162.017
Shrestha, S. (2017) The contested common pool resource: Ground water use in urban Kathmandu, Nepal. The Geographical Journal of Nepal. 10, pp. 153-166.
Dinesh Pathak Central Department of Geology, Tribhuvan University Kirtipur, Kathmandu, Nepal Email: dpathaktu@gmail.com
Dinesh Pathak Central Department of Geology, Tribhuvan University Kirtipur, Kathmandu, Nepal Email: dpathaktu@gmail.com
Abstract
This article focuses on the water-induced disaster (landslide and flood) conditions in Nepal. It analyzesThe past and present water-induced disaster conditions in the country haves been analyzed, the importance and means for creation of the database have been explored, identifies data gaps in water induced-disaster mitigation have been identified, explores the importance and means for creation of a database to house and organize data, visualizes the role of citizen scientists in data generation was visualized, and describes the efforts to date of S4W-Nepal there have been signified and described.
Introduction
The Himalayan region represents an active tectonic zone, and about 35% of the Himalayan belt lies in Nepal. The 147,515 km2 territory of Nepal can be divided into three main geographical regions; the Himalayan region covers 15% of the total area, the hilly region covers 68%, and Terai, also known as the food basket of the country covers 17% of the total area. The Himalayan terrain is formed by the complex geological process, which is still continuing to shape the Himalayan region. Such geological activities together with the hydrometeorological process have caused various types of hazards that eventually pose vulnerability to people, infrastructure, and natural resources. Thus, the larger population in the region has been exposed to multi-hazards, like earthquakes, landslides, soil degradation, flood, deforestation, loss of biodiversity, and drought.
Water-borne disasters like landslides, floods, soil erosion are common during the monsoon period in the entire Himalayan region. Snow avalanches are common, and glacial lake outbursts occasionally occur in the Himalayan region. These disasters have a significant impact on the natural system, settlements, and infrastructure in Nepal. In the past decades, climate change has been observed worldwide. For the future, predictions indicate average temperature rise, change in precipitation patterns in space and time, melting glaciers, sea-level rise, etc. with a large band of uncertainty. Likewise, extreme drought, intense rainfall, severe flood events, etc. are also predicted to occur more often under climate change conditions.
Different aspects of disasters like a landslide, dam outburst flood, the occurrence of landslides due to bank erosion by the river and slope instability, floods, and infrastructure failure causing landslides and floods, etc. are different sorts of water-induced disasters. Himalaya is extremely vulnerable to natural disasters due to its geology, steep slopes, high relief, and monsoon climates and among the different natural disasters, landslides are important geological events in many parts of the world (Pathak, 2016a).
Effect of past water induced disaster in the country
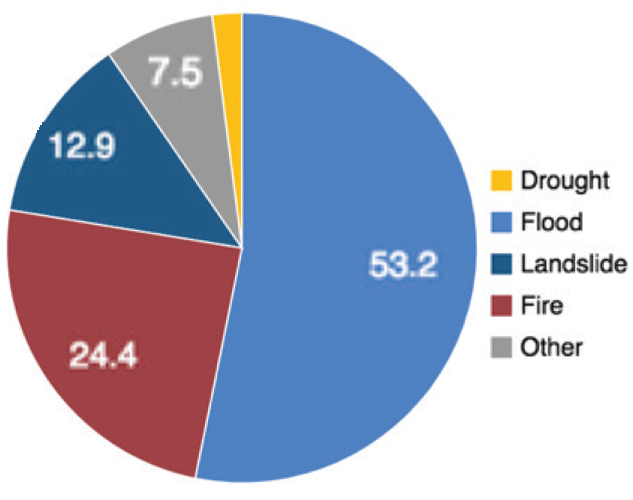
Water induced disasters (Landslide and flood disaster) have greater and regular impacts among all other disasters, which is evident from the highest mortality (66%) for the period between 1990 and 2014 (Figure 1).
Figure 1: Disaster mortality in Nepal between 1990 and 2014 (UNISDR, 2015)
Several events of water-induced disasters have increased the number of deaths, displacement of large numbers of families with damages to thousands of houses. It is quite convincing that these disasters are the major disasters in the country with an eminent impact on the people. Nevertheless, the earthquake disaster has a much greater and long term impact on all sectors of life even though it happens in a longer time interval. Even a single earthquake event can have more death, destruction of houses and infrastructure, as well as greater economic losses than the total due to other disasters in several decades.
The water induced disaster
Landslide and debris flow
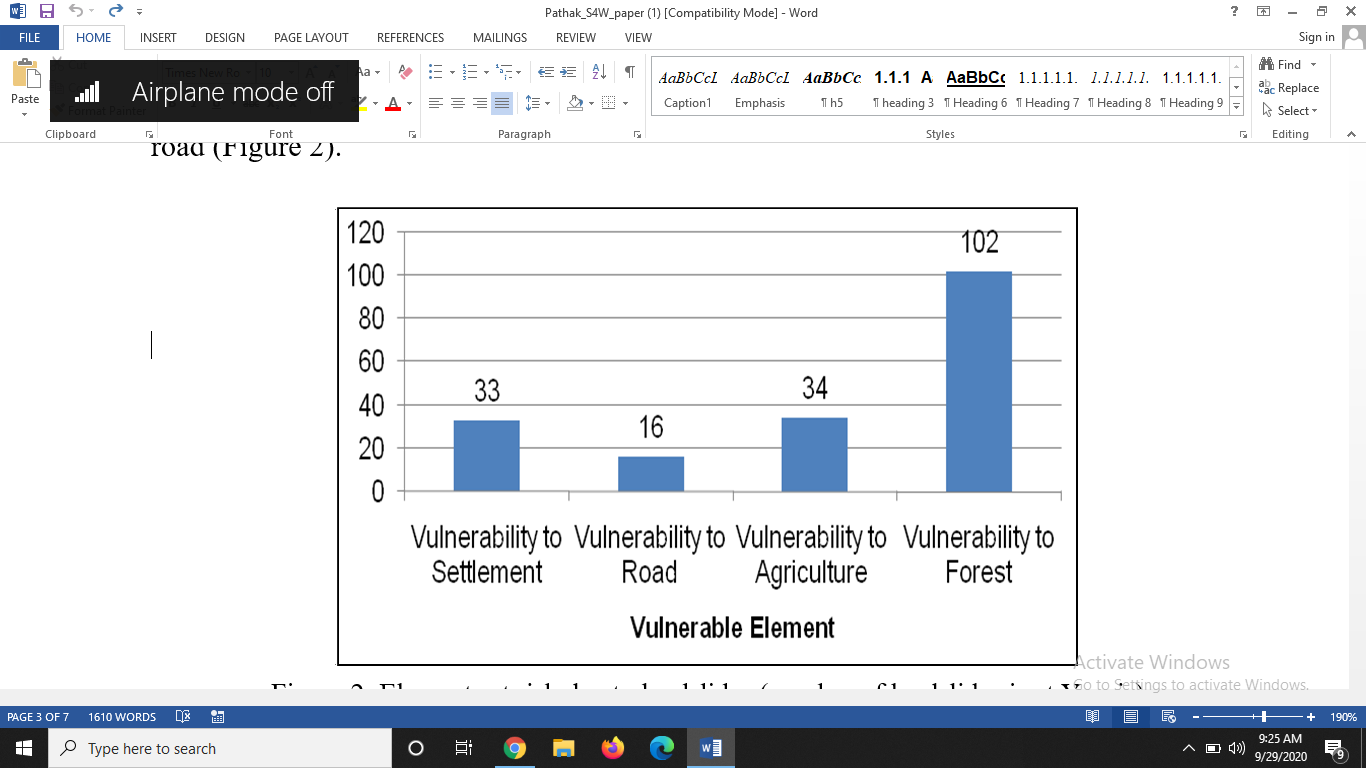
Landslides are common in all physiographic regions of Nepal, i.e. from the Chure range in the south to the Higher Himalayan region in the north. The analysis of landslide data in different regions of Nepal shows that in general, most of the landslides have occurred in elevation class between 500 m and 2000 m. Physiographically, landslide occurrence is more in Middle Mountain and High Mountain regions. Likewise, the topographic slope is another important factor for the occurrence of landslides, and the slope angle between 20 and 40 degrees is most sensitive for the landslide occurrence. Geologically, most slope instability issues are in Siwalik and Lesser Himalayan regions. Generally, we believe that the vegetation-covered areas are the stable ground; in contrast, the analysis of the data shows that in most of the cases, landslides occur in the forest area. It indicates that the vegetation is effective to provide ground stability only against the shallow slope failure, while for the deep-seated failure plane, especially below the root zone of the vegetation, large scale landslides may occur with significant damages to the forest land that may impose risks to other elements like settlement, agriculture land, and infrastructure at the downslope. An analysis of landslide vulnerability in eastern Nepal shows that many landslides have increased vulnerability to forest followed by agriculture, settlement, and road (Figure 2).
Figure 2: Elements at risk due to landslides (number of landslides is at Y-axis)
Google Earth’s image is useful for the rapid assessment of landslides in an area, and it is especially useful in the identification of large and disastrous landslides (Figure 3). Likewise, it is quite helpful to identify the earthquake-induced landslides through comparison between the images before and after an earthquake (Figure 4). Either a new landslide can be developed or the old inactive landslide could be triggered during an earthquake.
Figure 3: Landslide in (a) Okhaldhunga district located at Manebhanjyang Gaupalika; and (b) Sankhuwasabha district at Makalu Gaupalika
Figure 4: Damage to road from earthquake due to triggering of the old landslide as well as the development of a new landslide in Dhading (left image before the earthquake and right image after the earthquake)
Flood
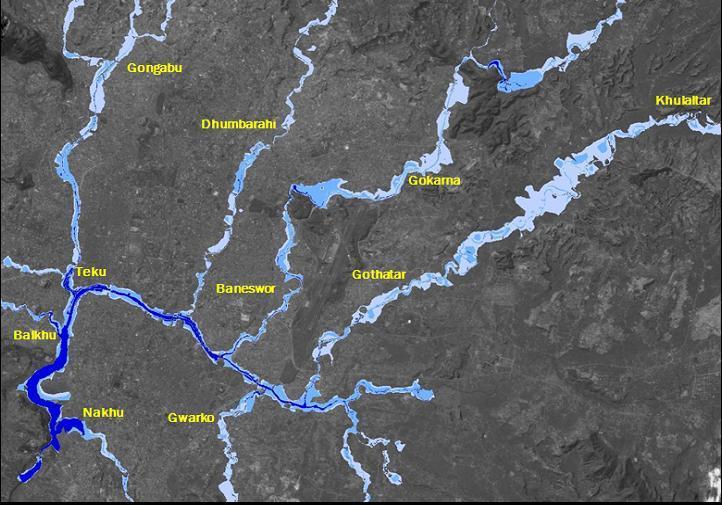
Flood is a common hazard that sometimes becomes a disastrous event due to its magnitude and presence of a large number of vulnerable elements. Such events are occurring both in the mountainous regions as well as in the Plain area. The rivers flowing through the Kathmandu valley have been heavily stressed due to encroachment as a result of urbanization. The natural regimes of the rivers are not maintained to the required waterway and also the natural regime of the river is much affected. This is the reason that many regions in the Kathmandu Valley are experiencing flood problems in each monsoon period. The flood hazard map of the Kathmandu Valley shows that both the urban core areas, as well as newly urbanized areas are prone to flood problems (Figure 5).
Figure 5: Flood hazard map of Kathmandu Valley. The deeper blue color shows deeper water level (Pathak et al., 2009).
Gaps in water induced disaster mitigation
In order to address the growing vulnerability due to the water-induced disaster, proper understanding of the biophysical, social, and institutional components is required. The water-induced disaster mitigation (WIDM) has been given the prime importance from the government of Nepal, however, a mounting disaster-induced loss indicates that disaster risk reduction is far from getting its due share of attention and resources (Pathak 2016b). Lack of seriousness and accountability of the decision-making authority, unavailability of the adequate database, low priority, and insufficient fund allocation for the disaster related study are some of the issues related to the inefficiency of disaster mitigation. Pathak (2016c) has pointed out some of the important measures to be considered for effective water-induced disaster management, which are listed below:
A hazard map is not adequate for planning rather risk map is more useful
A comprehensive disaster database will be supportive for disaster management
Prioritization of the watershed based on the water-induced disaster will facilitate effective disaster management
Regular monitoring and effective early warning system will reduce disaster loss
Institutional strengthening with effective coordination and networking among government line agencies
I/NGO should be given appropriate roles to work in coordination with the government in a supportive role. These organizations should work on various sectors as identified and prioritized by the government
Get prepared for the worst
Conclusion
Landslide and debris flow, as well as floods, are the major water-induced disasters in Nepal. There are many stakeholders for effective disaster management, namely government, non-government organization, disaster experts as well as the local residents. The role and activities of those stakeholders are almost defined, however, the role of local residents is least brought to the mainstream of disaster management. Data required for disaster management are available on national, provincial, and district level. However, there is a scarcity of data (like precipitation and flood discharge) at the local level, especially at the community level. These data are required to assess the disaster condition and to develop models required for disaster management. The local residents can be trained and given the responsibility to measure the hydrometeorological data so that a comprehensive database can be formed at the community level. Besides, these citizen scientists can act as valuable messengers to the community regarding community awareness in disaster management. S4W-Nepal has realised the importance of citizen science and its activities are focused to bridge the gap.
References
Pathak D, 2016a. Knowledge based landslide susceptibility mapping in the Himalayas. Geoenvironmental Disasters (2016) 3:8, DOI 10.1186/s40677-016-0042-0
Pathak D, 2016b. Water Induced Disaster Mitigation from Watershed Management Perspective in Nepal – An Example from Dobhan Khola Watershed, West Nepal. International journal of landslide and environment, vol. 4(1-3), 9-19.
Pathak D, 2016c. Water induced disaster mitigation in Nepal – present approach and way forward for effective water induced disaster mitigation from geological perspective. Disaster Review 2015, pp. 25-30.
Pathak D, Gajurel AP, Dwivedi SK, Shreshta GB, 2009. Flood risk mapping in urban area using high resolution satellite imageries. Proceedings of international seminar on hazard management for sustainable development, 29-30 Nov, 2009, Kathmandu, Nepal, (organized by Department of Water Induced Disaster Prevention, Nepal Engineering College and Ehime University). Eds. H.K. Shrestha, R. Yatabe and N.P. Bhandary, pp. 233-244.
UNISDR, 2015. Global Assessment Report on Disaster Risk Reduction 2015: Nepal. UNISDR Note: ‘Young Researcher’Issue 3 – Sept 2020
Rocky Talchabhadel Researcher, Kyoto University Board Member, S4W-Nepal
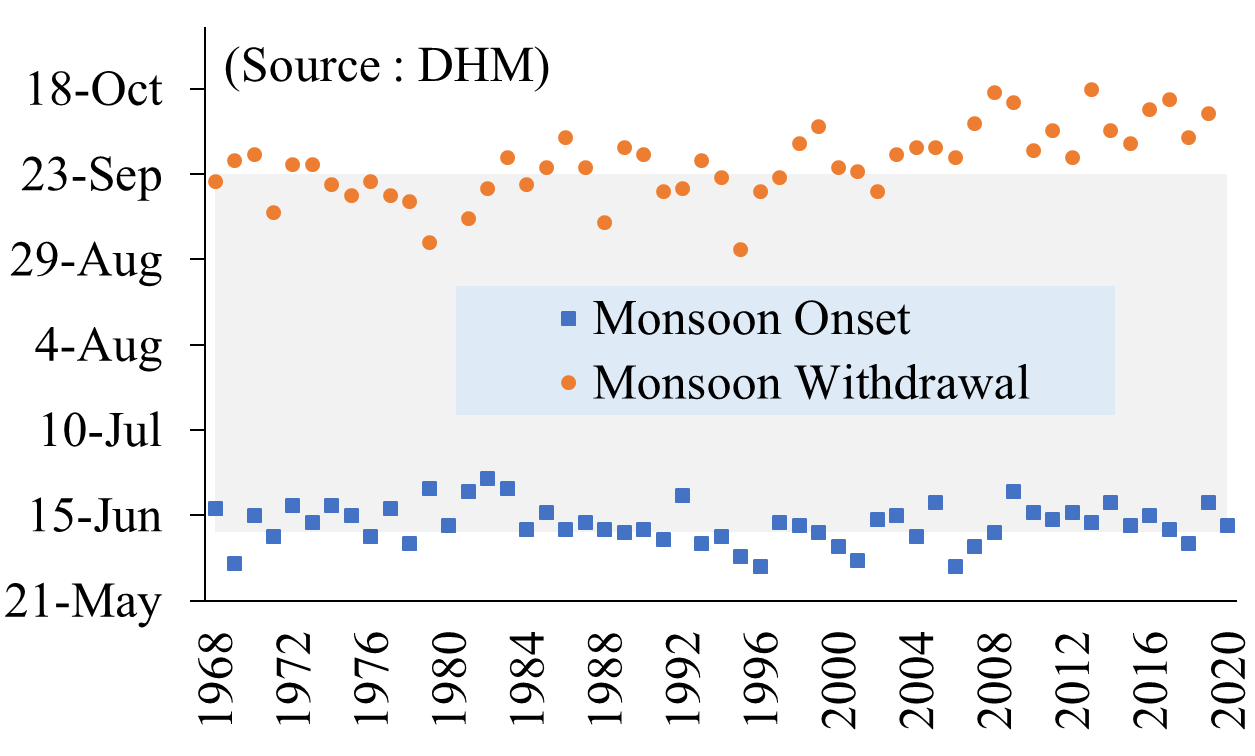
The word “Monsoon” comes from the Arabic word “mausim” which translates directly to ‘season’ in English. The monsoon season in Nepal and other parts of Central and Southeast Asia is characterized by a large seasonal shift in wind flow and direction accompanied by a dramatic increase in precipitation. Monsoon can be both boon and bane for inhabitants of this region. Extreme (heavy) precipitation during the monsoon season often results in major water-induced hazards such as floods, landslides, and debris flow. However, the monsoon season is equally important for agriculture and the economy. Lower than average monsoon precipitation, or even simply a later than average start date to the monsoon season, can have a disastrous impact on the nearly 3/4th of the population in Nepal that is dependent on agriculture. The nature of the monsoon precipitation – its amount, temporal variability, intensity, frequency of occurrence, and spatial variation is a major factor affecting agricultural potential. In Nepal between 1968 and the present, the average start and end dates for the summer monsoon are June 10th and September 23rd, respectively. Figure 1 shows the start and end dates, and average duration, during this period.
Figure 1: Monsoon onset (blue squares) and withdrawal (orange circles) and average onset and withdrawal (gray shaded area).
The country receives more than 80% of its annual precipitation during the monsoon season (Shrestha, 2000). Rice is a major food staple in Nepal. The planting of rice normally begins in early May in the hills and in June in the Tarai, the country’s food basket. The monsoon precipitation is directly linked with the growth of this rice crop and the country’s agriculture and in turn, the economy. This year (A.D. 2020) monsoon began in Nepal on the 12th of June. The monsoon season is characterized by not continuous but continual rain for a few days separated by rainless intervals. The long term temporal record of monsoon onset and withdrawal (Figure 1) shows a delayed monsoon withdrawal coupled with either altered or unchanged monsoon onset. The monsoon season is, in general, found to be longer in recent times. On average, six or seven monsoon depressions* (twice per month) move in every year, each corresponding to a period of about 17 days (Nayava, 1980). When the monsoon trough (a large depression) moves closer towards the foothills of Nepal (which we call active break-monsoon), heavy precipitation-related extreme events usually occur in parts, or across the whole, of Nepal. During such extreme precipitation events, floods (river floods, flash floods, urban floods) are likely to occur. The timing of flood/inundation and early warning mechanisms are crucial for effective mitigation of flood risks, along with mapping and understanding of flood-prone areas, which are, to some extent, predictable.
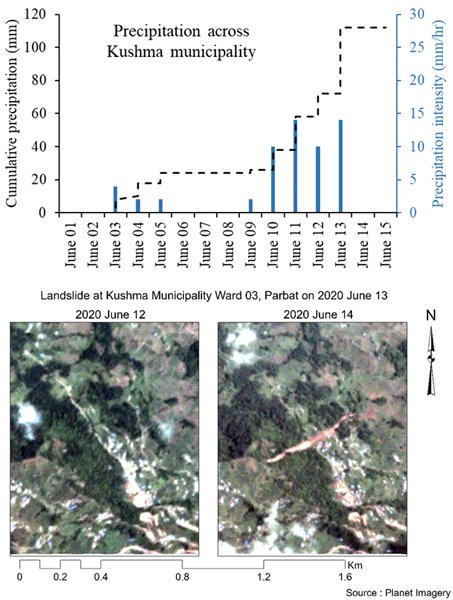
However, landslides and debris flow can sometimes even occur in unexpected areas. A recent example of a landslide followed by a debris flow at Kushma municipality, Parbat on June 13, 2020 highlights this point. The terrain, which never experienced a landslide before, experienced this, followed by a debris flow that was a devastating event affecting lives and property. Figure 2 shows a preliminary assessment of cumulative precipitation derived from hourly precipitation data of a satellite-based product, PERSIANN CCS (spatial resolution, 4 km) and the spatial location of landslide/debris flow before and after the event using Planet Imagery (spatial resolution, 3 m).
Even a single event with intense precipitation for a short period can bring urban inundation, land/mudslides, or flash flooding. Therefore, it is high time to map potential hazards and prepare for worst-case scenarios. You can’t manage what you don’t measure. Citizen-science based precipitation measurements can be used as a reference to calibrate and correct satellite-based precipitation estimates. Let’s measure.
Figure 2: Kushma municipality, Parbat landslide, and resulting debris flow.
Reference:
Nayava JL. 1980. Rainfall in Nepal. The Himalayan Review. Nepal Geological Society, 12.
Shrestha ML. 2000. Interannual variation of summer monsoon rainfall over Nepal and its relation to Southern Oscillation Index. Meteorology and Atmospheric Physics, 75: 21–28. https://doi.org/10.1007/s007030070012.
*Note: Monsoon depression: a depression that forms within the locations of relatively minimum sea level pressure in a monsoon region.
Young Researchers’ Circle Announcement & Activities
The Young Researchers’ Circle (YRC) is a voluntary, independent, collaborative, non-profit circle of young researchers/students that was founded in Spring 2020 by S4W-Nepal with an aim to promote and support citizen science-based water resource monitoring and management in the Kathmandu Valley and other parts of Nepal. The motto and objective of YRC is “Rejuvenating research among young aspiring minds” and YRC seeks to accomplish this via events, outreach programs, involvement in S4W-Nepal’s activities, and various networking opportunities.
The current ongoing activities of YRC include participation in S4W-Nepal’s Monsoon Expedition 2020, publication of a bi-monthly newsletter and a weekly Environmental News Refresher[1], and analysis of S4W-Nepal’s data. YRC plays a crucial role in the Monsoon Expedition in building a strong network of Citizen Scientists throughout the Kathmandu Valley (and other parts of Nepal) and motivates them to get involved in water-related research activities. YRC intends to build a good relationship between different colleges of Nepal, mobilize graduate-level students in water-related research, and help develop their skillset for the design, implementation, completion, and communication of research projects.
To date, YRC has published its first issue of the bimonthly newsletter ‘Young Researchers’ and six issues of the weekly Environment News Refresher. YRC has also conducted two online trainings, one on Open Data Kit (ODK) and one on ArcGIS, for the interested members of Young Researchers’ Circle for building their research skillset. Furthermore, YRC celebrated World Environment Day on June 5th by organizing an article writing competition among YRC members on the topic “Water as a whole to sustain biodiversity”. Finally, YRC has also conducted a video campaign in order to promote and conserve biodiversity.
In the near future, YRC plans to conduct webinars, facilitate managing and supporting conferences/events conducted by water-related organizations, become involved in various research activities and publications, and more. The YRC initiative has thus far been successful, and these new ideas will hopefully allow for its continued success and growth!
Sagar Gosai has been an active citizen scientist with S4W-Nepal for a long time and recently became vice-secretary of the Young Researchers’ Circle. Let’s hear a little bit from him about his experience as a citizen scientist and with S4W-Nepal.
Citizen Scientist’s Story
Namaste, I am Sagar Gosai. I am a third-year bachelor’s student studying Environmental Science at Khwopa College, Bhaktapur. I am an enthusiastic youth with a keen interest in the field of drinking water quality and its management. I was motivated and inspired to be a citizen scientist and got involved with S4W-Nepal through an outreach program conducted at my college. I have been actively collecting daily precipitation data for more than two years now, and have also been collecting daily evaporation data for the past six months.
S4W-Nepal has developed a low-cost gauge (each costs about $1.50 for materials and construction) to record these measurements, and these gauges are initially made available to citizen scientists by the organization for free. Considering the plastic pollution issues happening both locally and globally, I really appreciate the idea of reusing and repurposing plastic water bottles for measurement as well as the cost-effective data transmission methods through mobile application Open Data Kit (ODK) Collect. S4W-Nepal has made me aware of the importance of data collection and also helped me develop the capability to easily communicate with other fellow citizen scientists and local people about the data collection procedures and the importance of the data. I am very happy to be a part of S4W-Nepal and excited and eager to know how the data collected are being used in making wise water resource management decisions.
[1] The weekly Environmental News Refresher provides an overview of local, national, and international environmental news stories with some commentary.
The current COVID-19 pandemic and global shutdown have brought massive distress to the world in various ways. In our present situation, many people are unable to go to work, (or worse) have lost their jobs, children can’t go to school, and people are no longer allowed to freely socialize. On a global level, economy has drastically shrunk; on a personal level, some people are suffering mental breakdowns, and more. Everything is in chaos. Despite the prolonged health and socio-economic crisis, the lockdown has strangely enough presented an opportunity in some areas of science. People’s engagement in citizen science projects, resulting from more time away from others or at home, has been one of the small silver linings and unique opportunities of the pandemic for the scientific community.
Over the past couple of years, the term ‘citizen science’ has become much more common. The approach of citizen science – where ordinary citizens and scientists work together in scientific endeavors – generates new scientific knowledge and has the potential to collect valuable scientific data on a large scale. Citizen scientists can accomplish work on a scale that would be impossible for only trained scientists to achieve. Despite the pandemic situation, worldwide, numerous researchers have started scientific collaborations online, engaging citizens to participate in various citizen science projects. The projects range from recording species/biodiversity observed in our own backyards to bird counts to monitoring precipitation through rain gauges to studying outer space, all leading to new scientific discoveries and better understanding of the world (or galaxy!) we live in.
Initiatives by Smartphones4Water Nepal (S4W-Nepal)
Here at S4W-Nepal, we have been practicing and implementing this citizen science approach for the past three years for hydro-meteorological data collection. One of the programs of S4W-Nepal that we’ve implemented every year since our establishment is the Monsoon Expedition to track rainfall in Nepal during the summer monsoon. In the 2020 Monsoon Expedition, we aim to generate consistent, accurate rainfall data and provide the gathered information to the interested stakeholders. Our objective for this year was to expand our research outside of the Kathmandu Valley, with a focus on Kathmandu, Pokhara, Hetauda, Dharan, Biratnagar, and Chitwan. However, due to strict lockdown measures and travel restrictions, we were unable to conduct and facilitate the outreaches and programs that we had planned. Our detailed plan for the monsoon expedition 2020 and our past approaches are briefly explained here.
Amidst the pandemic, we were still able to recruit about 50 citizen scientists through social media platforms, and our citizen scientists took the responsibility to make their rain gauge to track the rainfall in their area. We provided them with instructions on rain gauge construction, data collection, and data submission along with follow up messages and calls on a timely basis. We also encourage questions and provide prompt feedback and responses to any queries from citizen scientists.
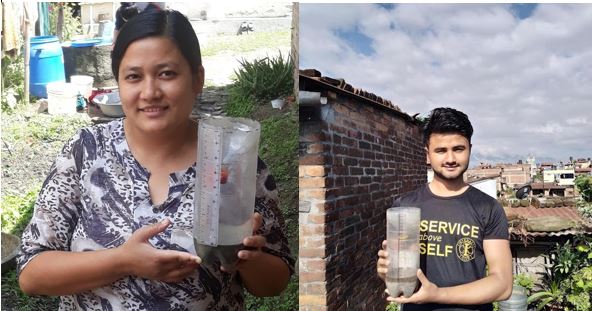
Figure 1: Citizen Scientists in Action – rain gauge preparation and rainfall monitoring by two S4W-Nepal volunteers.
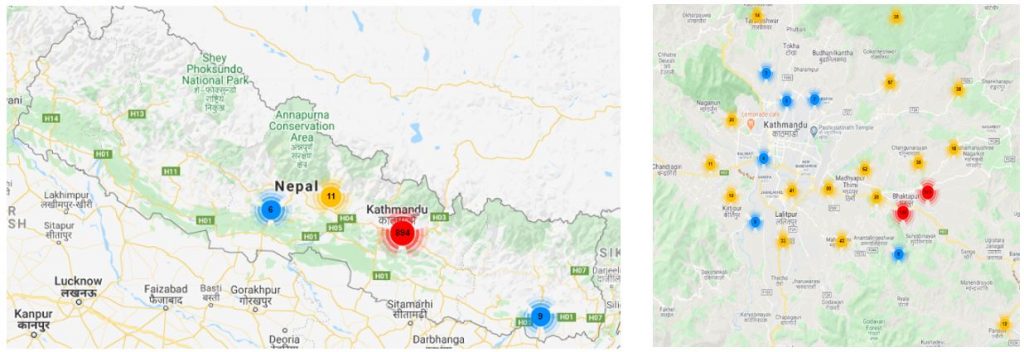
Figure 2: Precipitation stations all across Nepal with a major focus on the Kathmandu Valley from June 2020.
The driving factors for the involvement of citizen scientists in scientific projects include motivation to create a positive impact, time availability, personal or professional interest, and even boredom for those with lots of free time. To be a citizen scientist for S4W-Nepal, all you need is a smartphone with GPS capabilities and a camera and a bit of enthusiasm.
When the global situation normalizes in the post-pandemic period, will the popularity of citizen science and the number of projects gradually decline, or will it continue to grow? It is a worldwide concern for scientists, and we don’t know the answer. However, with the continuing emergence of new technologies and concepts, the wave of citizen science has also continued to rise in Nepal with constant support from several NGOs, INGOs, research institutions, and government. As a consequence, open knowledge sharing platforms between citizen scientists, scientific communities, experts, governmental bodies, and policymakers are continuing to develop and we hope that they will reach new heights shortly. We are excited to be a part of the process and along for the ride, and we hope you’ll consider joining us as a citizen scientist!
Rapid population growth, urban sprawl, and increasing developmental activities are leading to growing freshwater demands in the Kathmandu Valley. The limited availability of surface water has increased the people’s dependence on groundwater resources. Groundwater is an important source of drinking water in the Kathmandu Valley, contributing to roughly 50-70% of the total water supply (Chapagain et al., 2009). Unfortunately, the increasing extractions of groundwater have led to an abrupt decline in groundwater levels and also deterioration of groundwater quality. The variations in water quality are indicated by its physical, chemical and biological conditions, which are directly influenced by anthropogenic activities. These activities include introduction of untreated/partially treated wastewater, and excessive use of pesticides and chemical fertilizers in agriculture. The majority of people in Bhaktapur municipality in the Kathmandu Valley rely on groundwater for everyday domestic uses, but the degradation of groundwater quality has put the sustainability of groundwater resources under severe threat. Therefore, monitoring of groundwater quality should be done regularly so that the associated risks from the pollutants can be identified, better understood, and ultimately reduced or eliminated.
Groundwater quality is a complex subject to address, and a difficult water parameter to assess and evaluate, since it needs to consider multiple physico-chemical and biological parameters. Depending on the audience, assessment, evaluation, and communication of results is sometimes best done using a single metric that presents the information in simple terms. The water quality index (WQI) is one of the most effective ways of summarizing groundwater quality as it is a representative value reflecting the combined influence of various water quality parameters. WQI reduces the complexity of water quality data and presents the information in a simple and understandable manner to policymakers and concerned citizens. For those interested in specifics, the data inputs for determining the WQI can be evaluated individually.
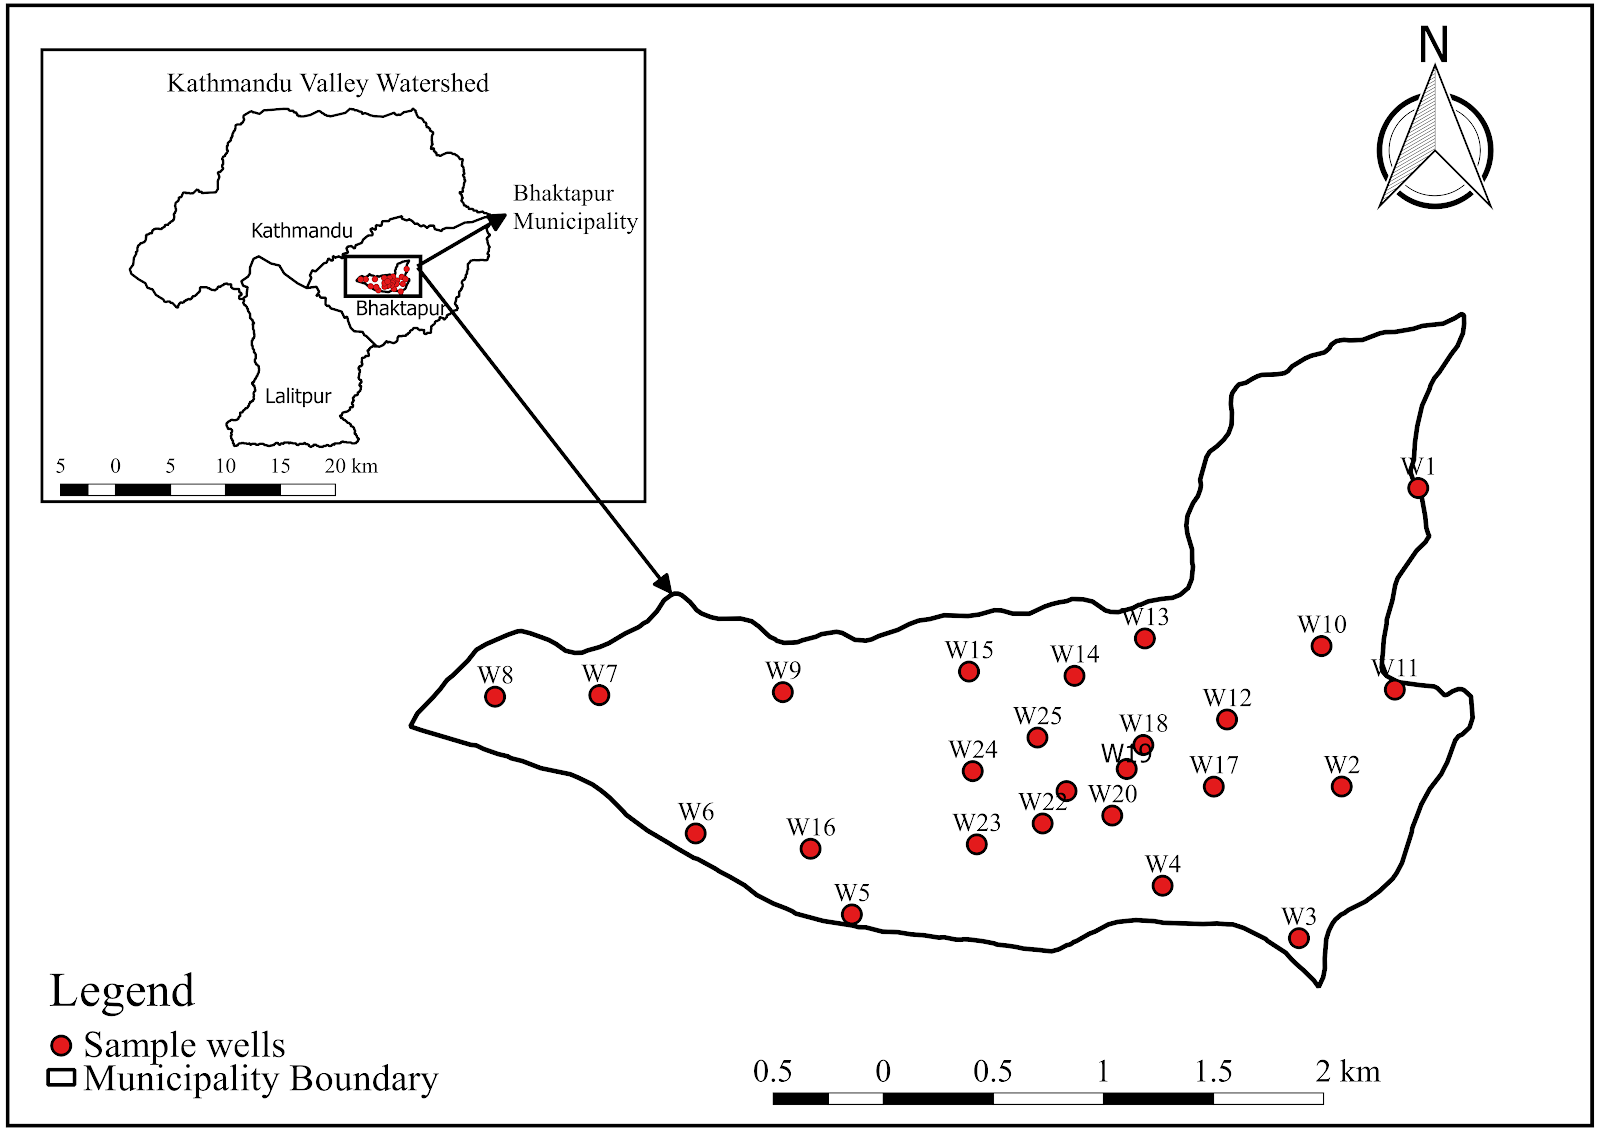
A study was conducted by SmartPhones4Water Nepal (S4W-Nepal) to develop a WQI value in order to assess the groundwater quality of the Bhaktapur municipality. This study was performed as a part of a young researcher-led citizen science project called SmartPhones4Water (S4W) that was focused initially in Nepal (S4W-Nepal) and is now expanding into other areas. For data collection, 25 sample wells (both public and private) were selected from the entire municipality considering the spatial coverage and the human settlements. The samples were collected during the pre-monsoon (May), monsoon (July), and post-monsoon (November) time periods of 2018.
Figure 2. Map of the study area with the locations of sample wells.
The public wells were typically open to the atmosphere, while the private wells typically had a covering. Groundwater samples were pulled up to the ground surface using a bucket and collected in 1 liter plastic bottles. The collected samples were subjected to a comprehensive analysis of 11 physico-chemical parameters including pH, electrical conductivity (EC), turbidity, total dissolved solids (TDS), total hardness, total alkalinity, chloride, phosphate, ammonia, iron, and nitrate. WQI was calculated by following the weighted arithmetic index method given by Brown et al., (1972) from the parametric values obtained from the analysis of physico-chemical parameters.
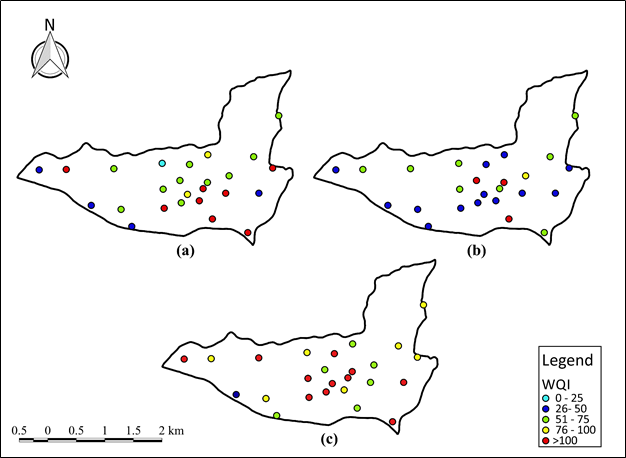
Figure 3. WQI results for study area from (a) pre-monsoon, (b) monsoon, and (c) post-monsoon sampling in 2018.
The WQI is expressed as a single number, with lower numbers representing better water quality and higher numbers representing poorer water quality. Numbers less than 25 are considered excellent quality, numbers between 25 and 50 are considered good quality, numbers between 50 and 75 are considered poor quality, numbers between 75 and 100 are considered very poor quality, and numbers over 100 are considered unsuitable for human consumption.
The WQI values in Bhaktapur municipality ranged from 23.03 to 943.15; the overall groundwater quality status of Bhaktapur municipality was determined to be of poor quality. 1.33% of water samples have excellent quality, 24% have good quality, 32% have poor quality, 13.33% have very poor quality and the remaining 29.33% were unsuitable for drinking purpose. The WQI values were found to be more sensitive to the parameters including turbidity, alkalinity and ammonia. The WQI distribution of sampling wells in pre-monsoon, monsoon and post-monsoon of 2018 is presented in figure 2. The seasonal fluctuation in water quality might be because of the monsoonal water influx and the dilution effect.
The reasons for the poor water quality of wells in the Bhaktapur municipality could be the cause of a variety of issues and influences. These include septic contamination, percolation of agricultural water containing pesticides and fertilizers, construction and demolition activities, and a direct influx of rainwater in open wells. In order to address any overland contamination, cover systems and regular maintenance and cleaning of the wells is recommended. The findings from this study may serve as an important foundation and frame of reference to guide future studies on the groundwater quality of the study area and efforts to improve water quality.
The three tables below include the water quality results for each of the wells from the three sampling periods and the resulting WQI values.
Table 1: Water quality results for sample wells during pre-monsoon 2018
Sample Wells
PH
EC (μS/cm)
TDS(mg/L)
Turbidity (NTU)
Nitrate (mg/L)
Ammonia(mg/L)
Phosphate(mg/L)
Chloride(mg/L)
Iron(mg/L)
Hardness (mg/L)
Alkalinity(mg/L)
WQI
W1
6.9
459
216
21
0
0.2
0.05
31.36
0.3
128
340
63.09
W2
6.8
808
380
7
0
0.2
0.05
62.72
0.3
216
570
48.28
W3
7.1
648
305
145
10
3
0.5
39.2
0.3
192
410
312.8
W4
7.3
1282
603
204
0
3
0.2
113.7
0.3
144
290
424.14
W5
7.3
859
404
7
0
0.5
0.05
62.72
0
136
510
39.11
W6
7.3
751
353
7
0
0
0.05
47.04
0
208
210
30.25
W7
7.1
1121
527
161
0
3
0.2
90.16
0.3
160
280
343.31
W8
7.1
544
256
6
0
1.5
0.2
35.28
0
128
350
36.08
W9
7.7
712
335
7
0
3
0.2
47.04
0
144
830
58.9
W10
6.8
1487
699
2
0
0
0.05
109.8
1
136
350
62.46
W11
7.2
1344
632
42
0
3
1
0.5
0.3
304
630
136.57
W12
7.7
1023
481
12
0
1.5
0.05
0.2
0.3
216
510
64.71
W13
7.3
1231
579
25
0
3
0.5
0.5
0.3
440
270
99.64
W14
7.9
1493
702
5
0
3
0.8
0.5
0
224
230
53.52
W15
8.3
780
367
2
0
0.2
0.2
1
0
168
280
23.03
W16
7.7
546
257
17
10
1.5
0.05
0.5
0.3
72
240
63.18
W17
12
1668
784
35
100
0.5
0.5
0.5
0
168
250
116.18
W18
8.8
668
314
10
10
0.2
0.5
0
0.3
120
880
58.47
W19
8.2
1108
521
64
10
3
1
0
1
152
420
191.77
W20
8.3
1295
609
34
10
3
1
0
1
368
270
140.49
W21
9.1
1170
550
24
0
1.5
1
0.2
0
136
360
78.2
W22
9.4
921
433
10
25
1.5
1
0
0.3
120
320
63.15
W23
9.1
1319
620
25
75
1
1
0
1
152
310
121.84
W24
9
1246
586
6
75
0.5
0.8
0
0
240
340
54.87
W25
8.8
1021
480
5
10
0.5
0.05
0
1
168
570
70.48
Table 2: Water quality results for sample wells during monsoon 2018
Sample Wells
PH
EC (μS/cm)
TDS(mg/L)
Turbidity (NTU)
Nitrate (mg/L)
Ammonia(mg/L)
Phosphate(mg/L)
Chloride(mg/L)
Iron(mg/L)
Hardness (mg/L)
Alkalinity(mg/L)
WQI
W1
6.7
742
349
19
0.2
75
0.05
31.36
0
184
50
62.92
W2
7.4
1859
874
4
0.2
0
0.2
39.2
0
384
100
38.77
W3
7.2
853
401
20
1
0
0.05
90.16
0
152
90
59.25
W4
7.7
272
128
95
1.5
10
0.2
90.16
0.3
64
50
202.08
W5
7.5
753
354
3
0
75
0.2
74.48
0
184
50
34.8
W6
7.8
921
433
4
0.2
50
1
58.8
0
176
60
36.31
W7
8.3
1863
863
8
0
100
1
39.2
0
264
40
62.2
W8
8.3
1078
507
5
0
50
0.5
43.12
0
184
20
37.08
W9
8.3
1065
501
8
1.5
50
0.05
31.36
0.3
144
200
61.88
W10
9
940
442
12
0.2
75
1
35.28
0
120
50
54.99
W11
8.2
604
284
9
0.2
50
1
43.12
0
64
25
39.36
W12
8.7
1746
821
8
3
25
1
47.04
0.3
272
130
77.3
W13
8.6
1193
561
1
1
10
0.8
54.88
0
80
50
29.78
W14
8.4
1125
529
1
0
75
1
39.2
0
104
30
34.46
W15
8.7
1504
707
11
0.5
50
0.8
43.12
0.3
120
70
65.29
W16
8.9
965
454
3
0.2
75
0.8
43.12
0
136
40
38.8
W17
8.7
1257
591
4
0
50
0.8
66.64
0
176
30
39.03
W18
8.5
1023
481
32
1.5
0
0.8
54.88
1
168
70
117.73
W19
8.8
921
433
8
0
10
0.5
47.04
1
112
70
64.29
W20
8.4
944
444
2
0
25
0.2
101.92
0
136
70
27.45
W21
8.6
823
387
5
1.5
10
0.05
113.68
0
96
70
37.68
W22
8
1287
605
3
0
25
0.05
35.28
0
144
40
29.23
W23
7.9
689
324
1
0
50
0.05
62.72
0.3
128
80
34.36
W24
8.2
1078
507
20
1.5
0
0.05
70.56
0.3
96
90
73.17
W25
8.3
870
409
34
3
0
0.05
125.44
0.3
96
40
106.77
Table 3: Water quality results for sample wells during post-monsoon 2018
Sample Wells
PH
EC (μS/cm)
TDS(mg/L)
Turbidity (NTU)
Nitrate (mg/L)
Ammonia(mg/L)
Phosphate(mg/L)
Chloride(mg/L)
Iron(mg/L)
Hardness (mg/L)
Alkalinity(mg/L)
WQI
W1
7.5
444
209
19
50
3
0
39.2
0
192
300
77.38
W2
7.6
519
244
155
25
1.5
0.05
47.04
0
248
640
319.46
W3
7
568
266
74
10
3
0.05
50.96
0
256
560
177.17
W4
7.7
714
336
16
10
1.5
0.2
50.96
0
320
800
70.8
W5
8.4
246
116
9
25
3
0.5
23.52
0
144
350
54.07
W6
7.6
723
340
5
0
1
0.05
82.32
0
384
660
45.41
W7
7.9
700
329
31
75
1
1
54.88
0
128
410
97.97
W8
7.7
787
370
24
100
3
0.8
86.24
0
160
250
101.02
W9
7.5
1195
562
86
10
3
1
19.6
0
352
1590
227.14
W10
7.6
817
384
21
25
1.5
0.8
90.16
0
168
600
79.68
W11
7.7
848
399
12
25
3
0.8
109.76
0
120
800
76.33
W12
7.8
980
461
16
10
1.5
1
129.36
0
128
680
72.31
W13
7.5
919
432
1
75
3
0.8
90.16
0
176
570
62.03
W14
7.8
1163
547
58
50
1
0.8
145.04
0
160
610
154.31
W15
7.7
855
402
28
0
1.5
0.2
109.76
0
160
620
88.21
W16
7.6
638
300
25
25
1.5
0.2
58.8
0
248
450
81.6
W17
7.7
568
267
16
10
3
0.5
66.64
0
280
580
74.77
W18
6.9
1082
509
143
0
1
0
164.64
0
408
570
301.11
W19
7.5
738
347
406
10
1.5
0
98
0.3
320
460
784.08
W20
7.8
961
452
19
50
1.5
0.05
86.24
0
288
430
79.9
W21
7.7
1044
491
178
10
3
0.5
31.26
0
352
1510
391.14
W22
7.3
972
457
412
10
1.5
0.05
160.72
5
256
590
943.15
W23
7.5
910
428
46
10
1.5
0.05
74.48
0
320
1130
133.71
W24
7.8
463
218
99
10
3
0.05
43.12
0
240
660
223.76
W25
7.7
1129
531
15
10
1
0.2
196
0
352
610
72.64
References
Brown, R.M., McClelland, N.I., Deininger, R.A. and O’Connor, M.F. (1972) A water quality index—crashing the psychological barrier. Indicators of environmental quality [online]. pp. 173-182. Available from DOI: 10.1007/978-1-4684-1698-5_15 [Accessed 7th September 2019]
Chapagain, S. K., Pandey, V. P., Shrestha, S., Nakamura, T. and Kazama, F. (2009) Assessment of Deep Groundwater Quality in Kathmandu Valley Using Multivariate Statistical Techniques. Water, Air, & Soil Pollution [online]. 210(1-4), pp.277–288. Available from DOI: 10.1007/s11270-009-0249-8 [Accessed 1st September 2019]
Water is one of our most precious and indispensable commodities. Smartphones4Water (S4W)-Nepal generates the data necessary to support both water users and policymakers in making wise water management decisions. In the Kathmandu valley of Nepal, extreme population growth has led to stress on water resources; the project initiated by S4W-Nepal has the objective of collecting the data necessary to quantify these stresses so that effective solutions can be identified, developed and implemented. S4W-Nepal leverages “citizen scientists” for the measurement of different components of water (precipitation, evaporation, water level, etc.) through use of an Android smartphone application called Open Data Kit (ODK) Collect. For the measurement of precipitation and evaporation, S4W-Nepal provides a local rain gauge to the citizen scientists. This approach is rapidly scalable and cost effective in a developing country like Nepal.
We have 60+ citizen scientists taking daily precipitation measurements in different parts of the Kathmandu Valley, covering the Valley spatially. Included below is an interview with Yurisha Duwal, one of our citizen scientists taking daily precipitation and evaporation measurements. Each citizen scientist has their own story and unique perspective to share. Keep reading to learn about her experiences working as a citizen scientist with S4W-Nepal, some of her personal interests, and some of her other thoughts.
Yurisha Duwal is a bachelor’s student studying to become a pharmacist at Little Angels College of Health Science. Since she is in her final year, her daily activities are very concentrated on academics, however, she has a keen interest in and really enjoys dancing and singing. Besides that, she loves travelling to new places and has so far explored the central and eastern parts of Nepal (Janakpur, Sauraha and Chitwan) and Darjeeling and Sikkim of India. She got involved in S4W-Nepal through one of her friends and learned more about our work through our website and social media (Facebook and Instagram).
In her interview, Duwal said ‘Data is an important aspect for management of any resource! Here, in this case, it’s water!’. She believes the water-related data collected by S4W-Nepal and citizen scientists will ultimately help in sustainable water resource management in the near future. She further added, ‘I had no idea about the citizen science concept. I thought citizen scientists should come from a scientific background with good academics at first. However, being a part of S4W-Nepal, I came to understand this modern concept of citizen science and became fascinated by it.’ Being a medical student, she was not related to the water resources field academically, however, as a responsible citizen, she believes it’s her duty to be aware and take care of the environment she lives in. She added, ‘I will always be happy to contribute to the environment from my side, whether that be a small contribution like data collection or any other contribution. This is one of the key factors that drove me to become a part of S4W-Nepal’. She further encouraged her friends to become citizen scientists and become aware of the importance of data collection. Additionally, Duwal is one of only a few citizen scientists taking evaporation measurements, which we think is fantastic and really appreciate.
She believes that to accomplish or achieve any goal (in this case, sustainable water resource management), huge actions are not mandatory; small actions by many can help achieve and contribute to a better change. A lot of little things added together can turn out to be a pretty big thing. Adding this idea to the message she shares with others, she tells her fellow citizen scientists and friends that even a single measurement and data point can make a huge difference and can bring a significant change in the field of research and implementation of more sustainable management strategies. She further encourages everyone to continually collect and send data.
Nepal is a developing country where expensive technologies and environmental monitoring equipment and methods are not affordable. In such an instance, Duwal appreciates the cost-effective initiative taken by S4W-Nepal in mobilizing citizen scientists, mobile technologies and young researchers in data collection. However, she also suggests that measures to enhance the data collection techniques looking forward into the implementation of sustainable management strategies will be an interesting project and thing to think of. Since thus far, S4W-Nepal has mostly focused on the Kathmandu Valley, she added that this interesting and fascinating concept should be introduced all over the rest of Nepal too.
Each day, Yurisha Duwal uses an Android application called Open Data Kit (ODK) collect to record rainfall and evaporation. These measurements are recorded using a locally made inexpensive gauge (each gauge costs about $1.50 USD, learn how to make your own here). Each gauge is provided to citizen scientists by S4W-Nepal for free.
S4W = young researchers + citizen scientists + mobile technology. Citizen science refers to collaborations between scientists and general people to fill important scientific data gaps and expand the horizon of scientific data collection. S4W-Nepal uses an Android application called Open Data Kit (ODK) for data collection with the help of citizen scientists. The advanced mobile technology with good GPS and camera have improved the reliability and accuracy of citizen science observations. The citizen science approach is cost effective and rapidly scalable.
The growing imbalance between water demand and supply has stressed the quality and quantity of the water resources in the Kathmandu Valley of Nepal. Haphazard urbanization along with a lack of integrated land use planning has both affected surface water and restricted the recharge potential of the underlying groundwater resources. Precipitation is the only way of recharging surface and groundwater sources (including streams, springs, wells and stone spouts), and the Valley receives 80% of its total rainfall during monsoon (i.e. from June to September). If you’re not sure what a stone spout is, you should read one of our older stories here! Roughly two-thirds of the cultivable land in Nepal is rainfed rather than irrigated, so uneven and erratic rainfall patterns also severely affect the agricultural productivity of the country (Malla, 2008). There is a large issue to be addressed here. However, for effective planning and management of these water resources, the critical first step is that the problem needs to be characterized and better understood. Then, all relevant information should be forwarded to concerned stakeholders and decision makers for responsible action and wise management decisions.
One of S4W-Nepal’s major objectives is generating good spatio-temporal hydro-meteorological data (e.g. when and where is water moving, and how much, and of what quality) as part of the critical first step mentioned above; these data are necessary to support wise water management decisions. To this end, S4W-Nepal has launched the Monsoon Expedition 2019 with a slogan “Count the drops, before it stops!”. For data generation, S4W-Nepal leverages the power of young researchers, citizen science, and mobile technology. We use an Android smartphone application called Open Data Kit (ODK) Collect to measure different components of water (e.g. precipitation, water flow, water quality, etc.) with the help of citizen scientists (CS). Advances in mobile technology through increased GPS accuracy and high-resolution cameras have undoubtedly improved the accuracy and reliability of citizen scientists’ observations. For measuring precipitation of the Valley, S4W-Nepal uses a local rain gauge constructed of readily available repurposed materials costing less than a dollar and we provide it to CS for free. This approach is both lower in cost and more rapidly scalable than other traditional methods of measuring precipitation. This story will focus on various aspects of our Monsoon Expedition 2019. It is currently ongoing, and we hope you enjoy this little glimpse into what we do 🙂
Aspects of Monsoon Expedition 2019
Citizen Scientist Recruitment
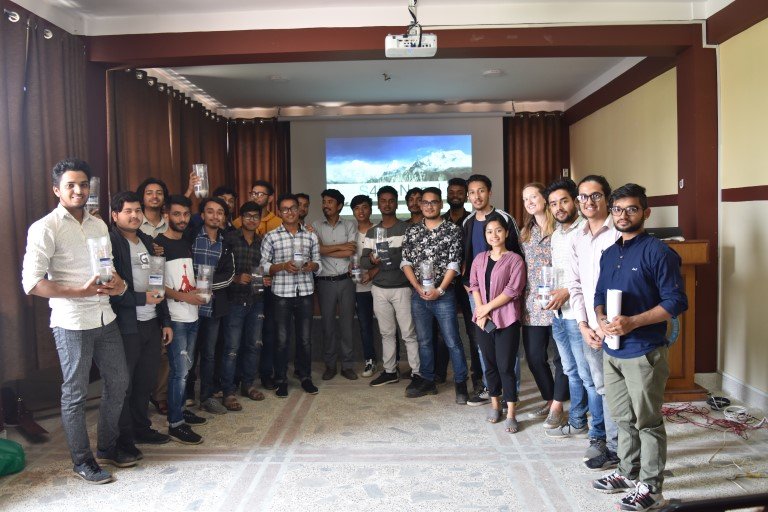
Almost all CS are recruited by one of three methods: through personal contacts and word-of-mouth, through outreach programmes and through social media (using Google Forms). We’ll describe the outreach programmes in more detail. As a part of the monsoon expedition this year, S4W-Nepal conducted two outreaches in the Valley leading up to the monsoon season for Bachelor’s level and graduate level university students. The group from one of these outreaches is pictured below in Figure 1. The main purpose of these was to raise awareness among university students about current water-related issues, possible management measures and the importance of data for informing management decisions. The outreach programmes have been a good opportunity to share our ongoing research and what we’ve learned through the process. Finally, we also provide a platform for all who attend the outreach programmes to participate in data collection. This year we have dozens of Nepali and foreign undergraduate and graduate students involved as volunteers and interns discussing water-related issues that the Valley currently faces and hopefully assisting in a step towards better water management.
Figure 1: Outreach program at Kantipur Engineering College (KEC) in May, 2019; Bachelor’s level engineering students participated
Citizen Scientist Motivation
Motivation is one of the most important driving factors for CS; it is critical for keeping their interest alive and a high continuation rate in data collection. Some of the actions we take to help motivate CS include sending weekly acknowledgement texts to CS every Friday that encourage them and show the incredible positive impact they can have just through data collection. Social media has also been a good medium for the spread of news and necessary information to our targeted audience. We often disseminate data collected and sent in by our CS through social media, whether it is regarding a major rainfall event or any campaign findings.
Citizen Scientist Follow Up
This year during Monsoon Expedition 2019, we have the goal of conducting immediate follow-up calls to CS after quality control of their data to reduce the repetition of mistakes (if any) and also to thank and encourage them for taking regular measurements. Also, we are planning to do bi-weekly or weekly follow up with CS if there is any sort of discontinuation in the data set and perform field visits if necessary in urgent cases.
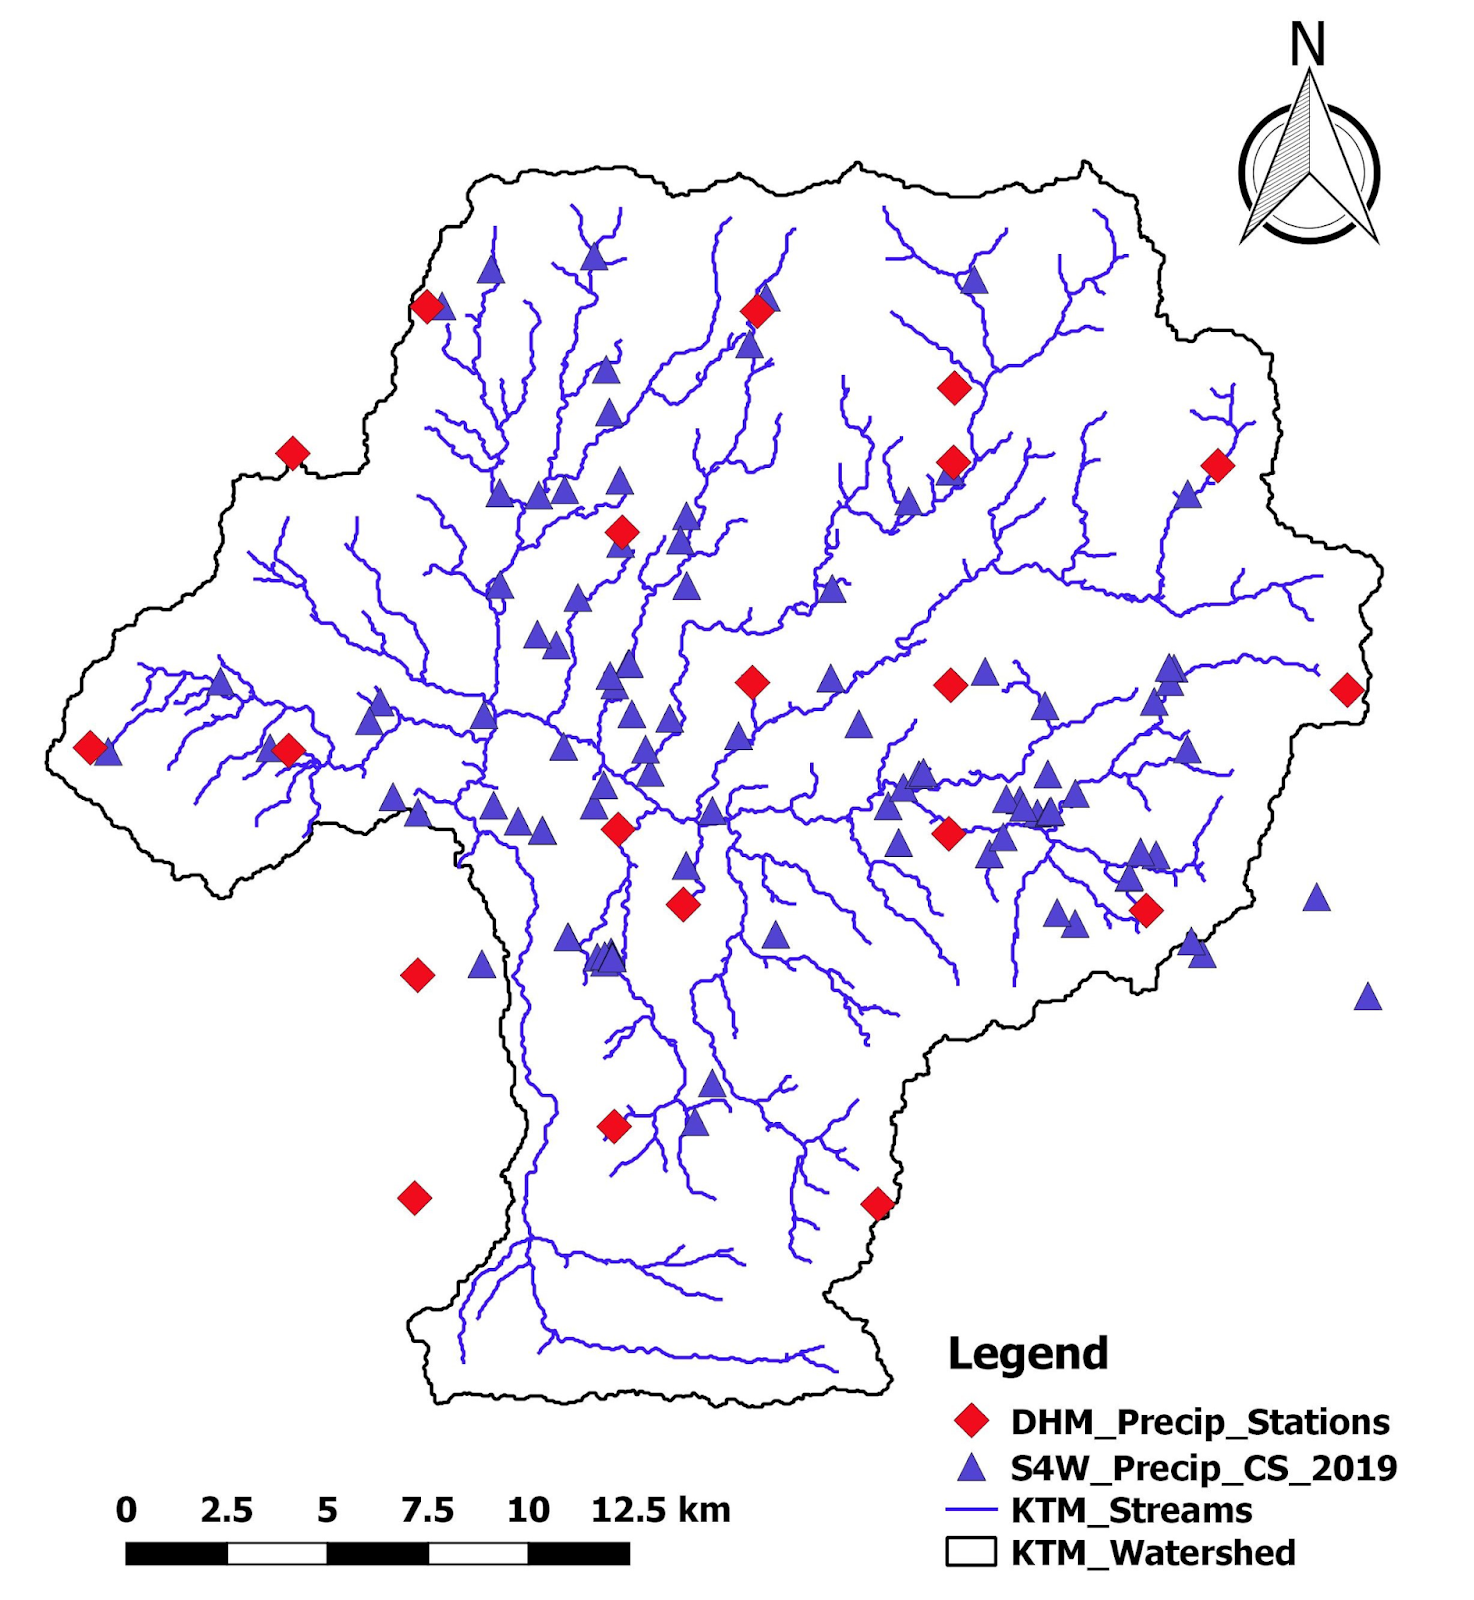
Spatial distribution of Precipitation CS in the Valley in 2019
As of the beginning of June 2019, about 60 CS were recruited via the three recruitment methods listed in the Recruitment section to cover a large portion of the Valley (Figure 2). The areas that we are focusing on are primarily the ones having Department of Hydrology and Meteorology (DHM) stations. During the 2018 monsoon, we attempted to recruit as many CS as possible and collect as much data as possible. In 2019, we are shifting our focus towards a focus on data quality rather than quantity. Our goal is that good and reliable spatio-temporal precipitation data could be generated and used to inform water management decisions in the future.
We also love getting to know our CS through working together, and we want you to get to know them as well, because they’re great! Every so often, we publish an interview or story about one of our citizen scientists as well. Our most recent one is available here.
Thank you for taking an interest in our work and reading about what we’re up to this summer as part of Monsoon Expedition 2019!!
Figure 2: Spatial distribution of citizen scientists measuring precipitation in the Kathmandu Valley in 2019.
References
Malla, G. (2008) Climate change and its impact on Nepalese agriculture. Journal of agriculture and environment. 9, pp.62-71.
Water is one of our most precious and indispensable commodities. Putting our favorite Lord Kelvin phrase into action (‘You can’t manage a resource you don’t measure’), SmartPhones4Water (S4W)-Nepal generates data to support students, researchers and policymakers in making wise water management decisions. Extreme population growth has led to stress on the water resources of the Kathmandu Valley, and the project initiated by S4W-Nepal has the objective of collecting the data necessary to quantify these stresses and inform sustainable water management, so that effective solutions can be developed and implemented. Although we began in the Kathmandu Valley, S4W-Nepal has recently been expanding efforts and data collection into other regions of Nepal as well.
Included below is an interview with Sadam Bala, one of our citizen scientists taking daily precipitation measurements. Each citizen scientist has their own story and unique perspective to share. Let’s see what some of his personal interests, experiences working as a citizen scientist in S4W-Nepal and other thoughts are.
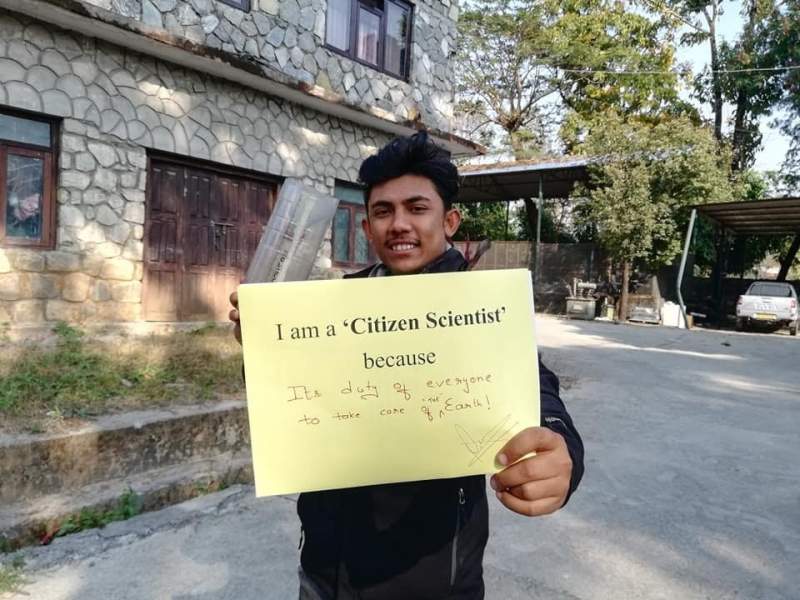
Fig: Citizen Scientist
Currently working at Nepal Electrical Authority (NEA) in Pokhara as an Electrical Engineer, Sadam Bala was born and raised in Bhaktapur. He completed his Bachelor’s in Electrical Engineering at the Institute of Engineering (IOE), Pulchowk Campus, which is one of the most prestigious engineering colleges in Nepal. Along with his work, he is currently enrolled in Western Regional Campus in Pokhara, pursuing his Master’s in Distributed Generation. Besides academics and work, his personal interests are travelling to new places and up to now, he has travelled several districts of Bagmati, Gandaki, Dhaulagiri and some parts of the mid and far-western regions of Nepal. He looks forward to continuing to travel and explore new places! He loves exploring and learning about new things and the modern concept of ‘citizen science’ fascinated him and drew him into being a part of S4W-Nepal.
It has been a year since Bala became involved in S4W-Nepal as a citizen scientist taking daily precipitation measurements. He is one of only a few citizen scientists from Pokhara. In his interview, Bala said, ‘Data collection is the basis for scientific research.’ He believes effective and informative research is an outcome of good data, and good data is also the basis for appropriate management of natural resources (including water!) both in the present and looking to the future. He further added, ‘It is not a tough job to take a picture and send data through a mobile application. It only takes a few minutes a day, not at all time consuming’. He feels happy to be able to participate in scientific research with minimal effort. Bala was aware of the importance of the citizen science concept as in his interview he highlighted citizen scientists as a critical part of research. Through S4W-Nepal, he has learned about existing problems and data gaps in the water resources field and how citizen scientists can reduce or eliminate those data gaps.
To his fellow citizen scientists, he conveys a message that these types of projects help an individual learn new and interesting things and can make them aware of existing problems that need to be addressed. Besides, citizen science projects can help built a network among individuals with different experience and backgrounds, which can be crucial in their personal development as well as for overall community or nation-building in the long run. From his personal experience, he suggests that his fellow citizen scientists be dedicated, self-motivated and work selflessly as the work is important and only requires a few minutes each day.
Each day, Sadam Bala uses an Android application called Open Data Kit (ODK) to record rainfall collected by an inexpensive locally made rain gauge (each gauge costs about $1.50 USD). Bala is motivated to participate in the project because he is fascinated by the citizen science concept, and he understands that data collection is a very important part of scientific research. Because of this, he is also eager to participate in large scale data collection in the near future if any opportunities are available.
Citizen science helps ordinary people increase their scientific understanding. All it takes is a smartphone with good GPS, a camera and access to the Internet to deinstitutionalize science and help the inner scientist in all of us grow, learn, and participate in scientific work on a broader scale. It gives every one of us opportunities for better understanding of a variety of subject matters, from water resources to backyard birds to the time of year that flowers are in bloom.
YOU CAN BE A CITIZEN SCIENTIST TOO!!!!
S4W = citizen science + mobile technology + young researchers. Citizen science refers to collaborations between scientists and general people to fill important scientific data gaps and expand the horizon of scientific data collection. S4W-Nepal uses an Android application called Open Data Kit (ODK) for data collection with the help of citizen scientists. The advanced mobile technology with good GPS and camera have improved the reliability and accuracy of citizen science observations. The citizen science approach is very cost effective and rapidly scalable.